I've noted some positive price action in the uranium sector this week. What I am seeing is break-outs in a many of the Junior Uranium stocks. This is also true for larger uranium stocks too. When I see this kind of sponsorship across a sector, my radar perks up and I get interested. I suppose there could be something fundamental going but I use charts and relative strength to “see” the market. However, I do think it might have something to do with two things. Firstly, the Junior Uranium stocks have been “nuked” this last year or so and to say that prices are depressed is to pronounce an understatement of laughable proportions. If there isn’t much punishment left for this sector then a reversal is in order. Secondly, it may have something to do with what is happening in the options markets and I will get to that in another post. For now, I am going just look at some candidates in the sector.
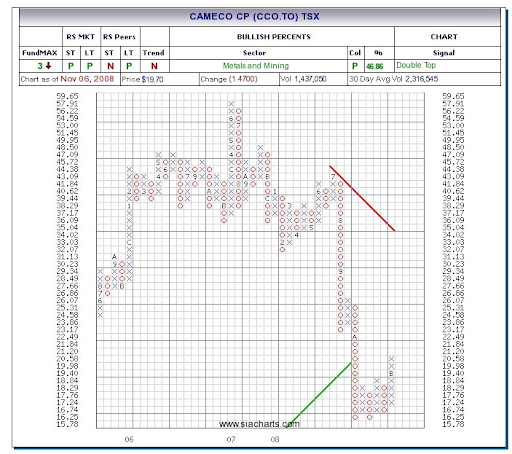
In the Senior sector Cameco has been punished right back to 2004 levels but has recently broken-out. I show a Point and Figure Chart using a 3% scale in order to look at a slightly longer-term picture. If I am going to be bullish (I mean speculative) on the Juniors, I will also consider a top performer in the Senior space and that would be Cameco.
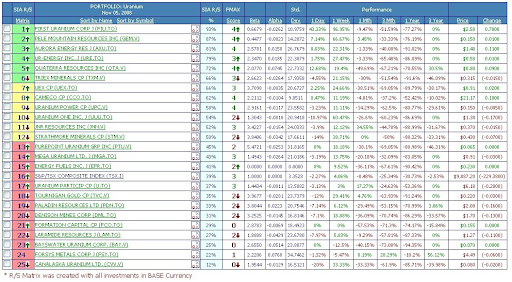
Playing Juniors is risky and I am only interested in those with good liquidity and to mitigate risk, I would likely diversify by taking positions in a few names. But what few names? I’ll let the market tell me by using the Relative Strength Matrix because I want to be buying only those stocks with top technical attributes and top relative strength. In other words, I want to buy what the market wants to buy. This isn’t herd mentality but simply an appreciation of strength and the recognition that I don’t want to fight the market (I will lose every time).
Below I show a snapshot of the RS Matrix based on 2% Point and Figure signaling for some Canadian junior uranium stocks. As a benchmark, I also show the TSX index and I throw in Cameco too. The RS Matrix compares every stock on the matrix to each other stock and the stocks with the greatest number of positive technical attribute get ranked the highest. This tells me who is outperforming the TSX as well as who the top leaders in this peer group are. I think this is early and the leaders are subject to change but I have to start somewhere. Also, a note of caution. Some of these stocks are penny stocks. They might not have started that way but after what the market has been through, they now are. As a result, they can have large movements in a short time which means they can move around in the matrix. This is definitely a risky sector with many stocks down 80 or 90 percent in the last year. Right now, we see a lot of positive action in the last week with 14 Juniors and Cameco outperforming the TSX.